
This is the main result from the climate summary stated in the ACF-8 Consensus statement, for temperature and precipitation during June, July and August 2021, and sea ice for September 2021. View the full climate summary presentation for more details. The combination of an Arctic meridional and zonal atmospheric circulations (north-south and west-east respectively) and lower than in 2020 ocean surface heating this summer was the main driver of this past season’s temperature, precipitation and sea ice anomalies.
Temperature JJA 2021 Summary
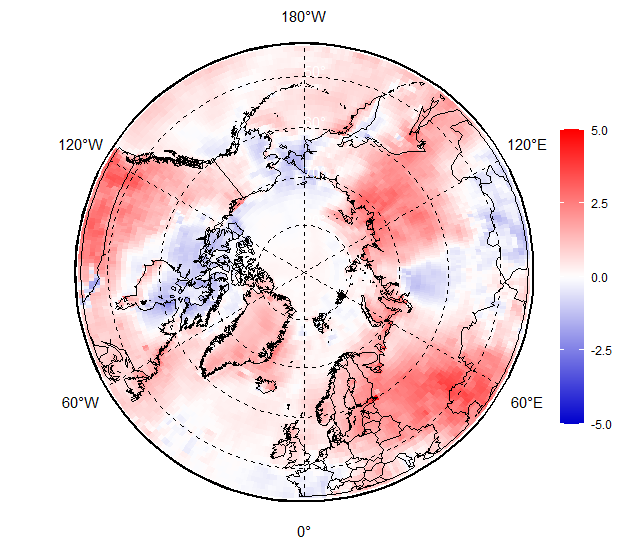
The figure below shows June, July and August (JJA) 2021 surface air temperature anomaly based on the 1991-2020 reference period. Red indicates warmer than normal temperatures, and blue indicates cooler than normal temperatures. The map is produced by the Arctic and Antarctic Research Institute http://www.aari.ru with ERA-5 as data source.
Summer 2021 was characterized by an average surface air temperature (SAT) anomaly (relative to 1961-1990) of +1.4°С and was the 5th warmest since 1936. The SAT anomaly for the latitudinal zone of 70- 85°N was +1.2°C and 7th in rank, and for the latitudinal zone 60-70°N, the SAT anomaly was +1.5°C and 4th in rank since 1936. Regional analysis shows the most significant positive SAT anomalies in the Eurasian sector (red areas in the figure below). The SAT anomaly for the Eastern Siberia region was +2.9C and was the warmest year 1936. The southern Chukchi and eastern Beaufort Seas were characterized by slight negative SAT anomalies (blue areas in the figure below). In the Arctic seas, the highest positive anomalies were for the northern part of the Greenland and Norwegian Seas, as well as in the Asian sector - the Laptev and East Siberian seas. In the Laptev Sea area, the SAT anomaly was +2.6°C and the second highest since 1936.
Click image to see forecast and climate summary side by side.
×
Forecasted temperature for June, and August 2021.
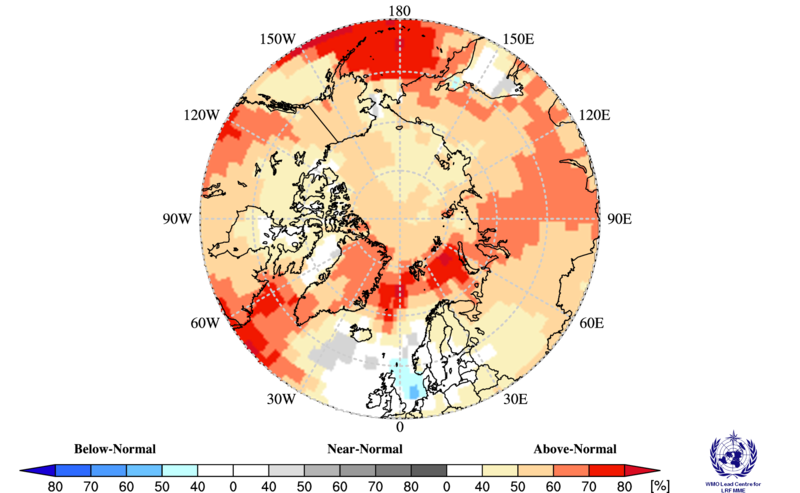
Temperature summary for the same period.
Precipitation JJA 2021 Summary
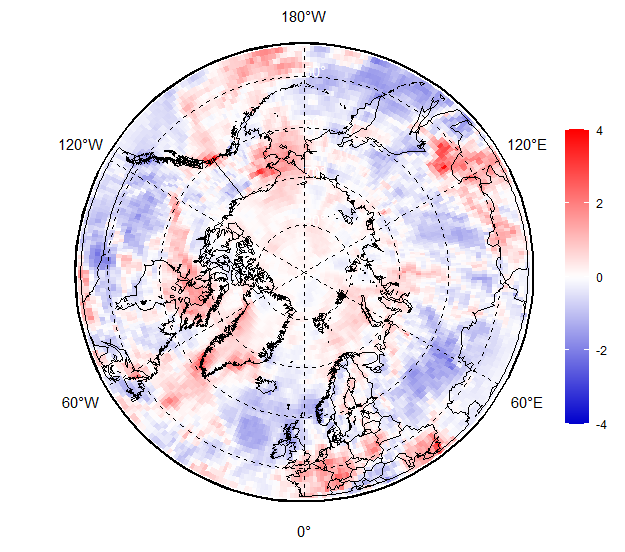
The figure below shows JJA 2021 precipitation based on the 1991-2020 reference period. Red indicates wetter than normal conditions, and blue indicates drier than normal conditions. The map is produced by the Arctic and Antarctic Research Institute http://www.aari.ru with ERA-5 as data source.
Wetter than normal conditions were observed over most of the Nordic regions, the eastern Canadian Arctic and western Alaska (red areas). Drier than normal conditions were observed across the Russian Arctic and western Canada (blue areas). Analysis of the interannual changes for the period 1936-2021 (not shown here) shows a (statistically insignificant) tendency towards a decrease in summer liquid precipitation for the whole region. In the Arctic seas, over the entire observation period, with the exception of the northern Greenland and Norwegian Seas, as well as the Beaufort Sea, a downward trend in precipitation occurred. The largest decrease in precipitation is for the Eurasian Seas. In the last 30-year period, a tendency towards an increase in the amount of liquid precipitation has appeared in some latitudinal zones, mainly due to the increase in liquid precipitation in the Eastern Nordic and West Siberia regions. However, the values of the linear trends in these areas are not statistically significant.
Click image to see forecast and climate summary side by side.
×
Forecasted precipitation for June, July and August 2021.
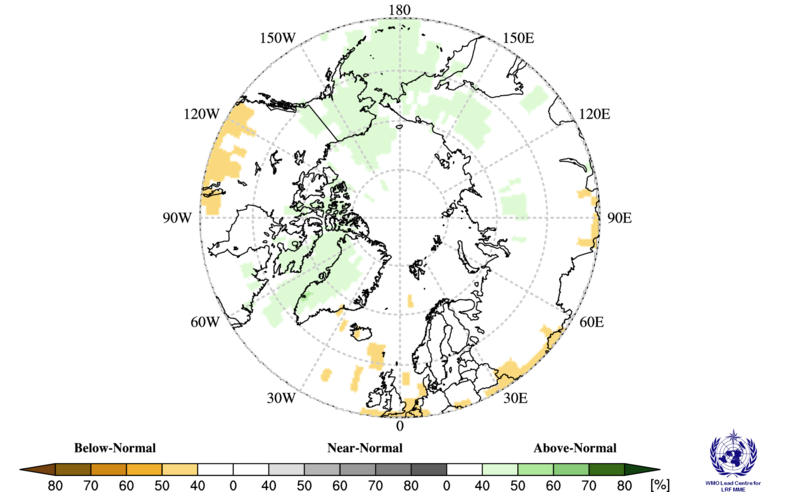
Precipitation summary for the same period.
Sea Ice Summary for September 2021
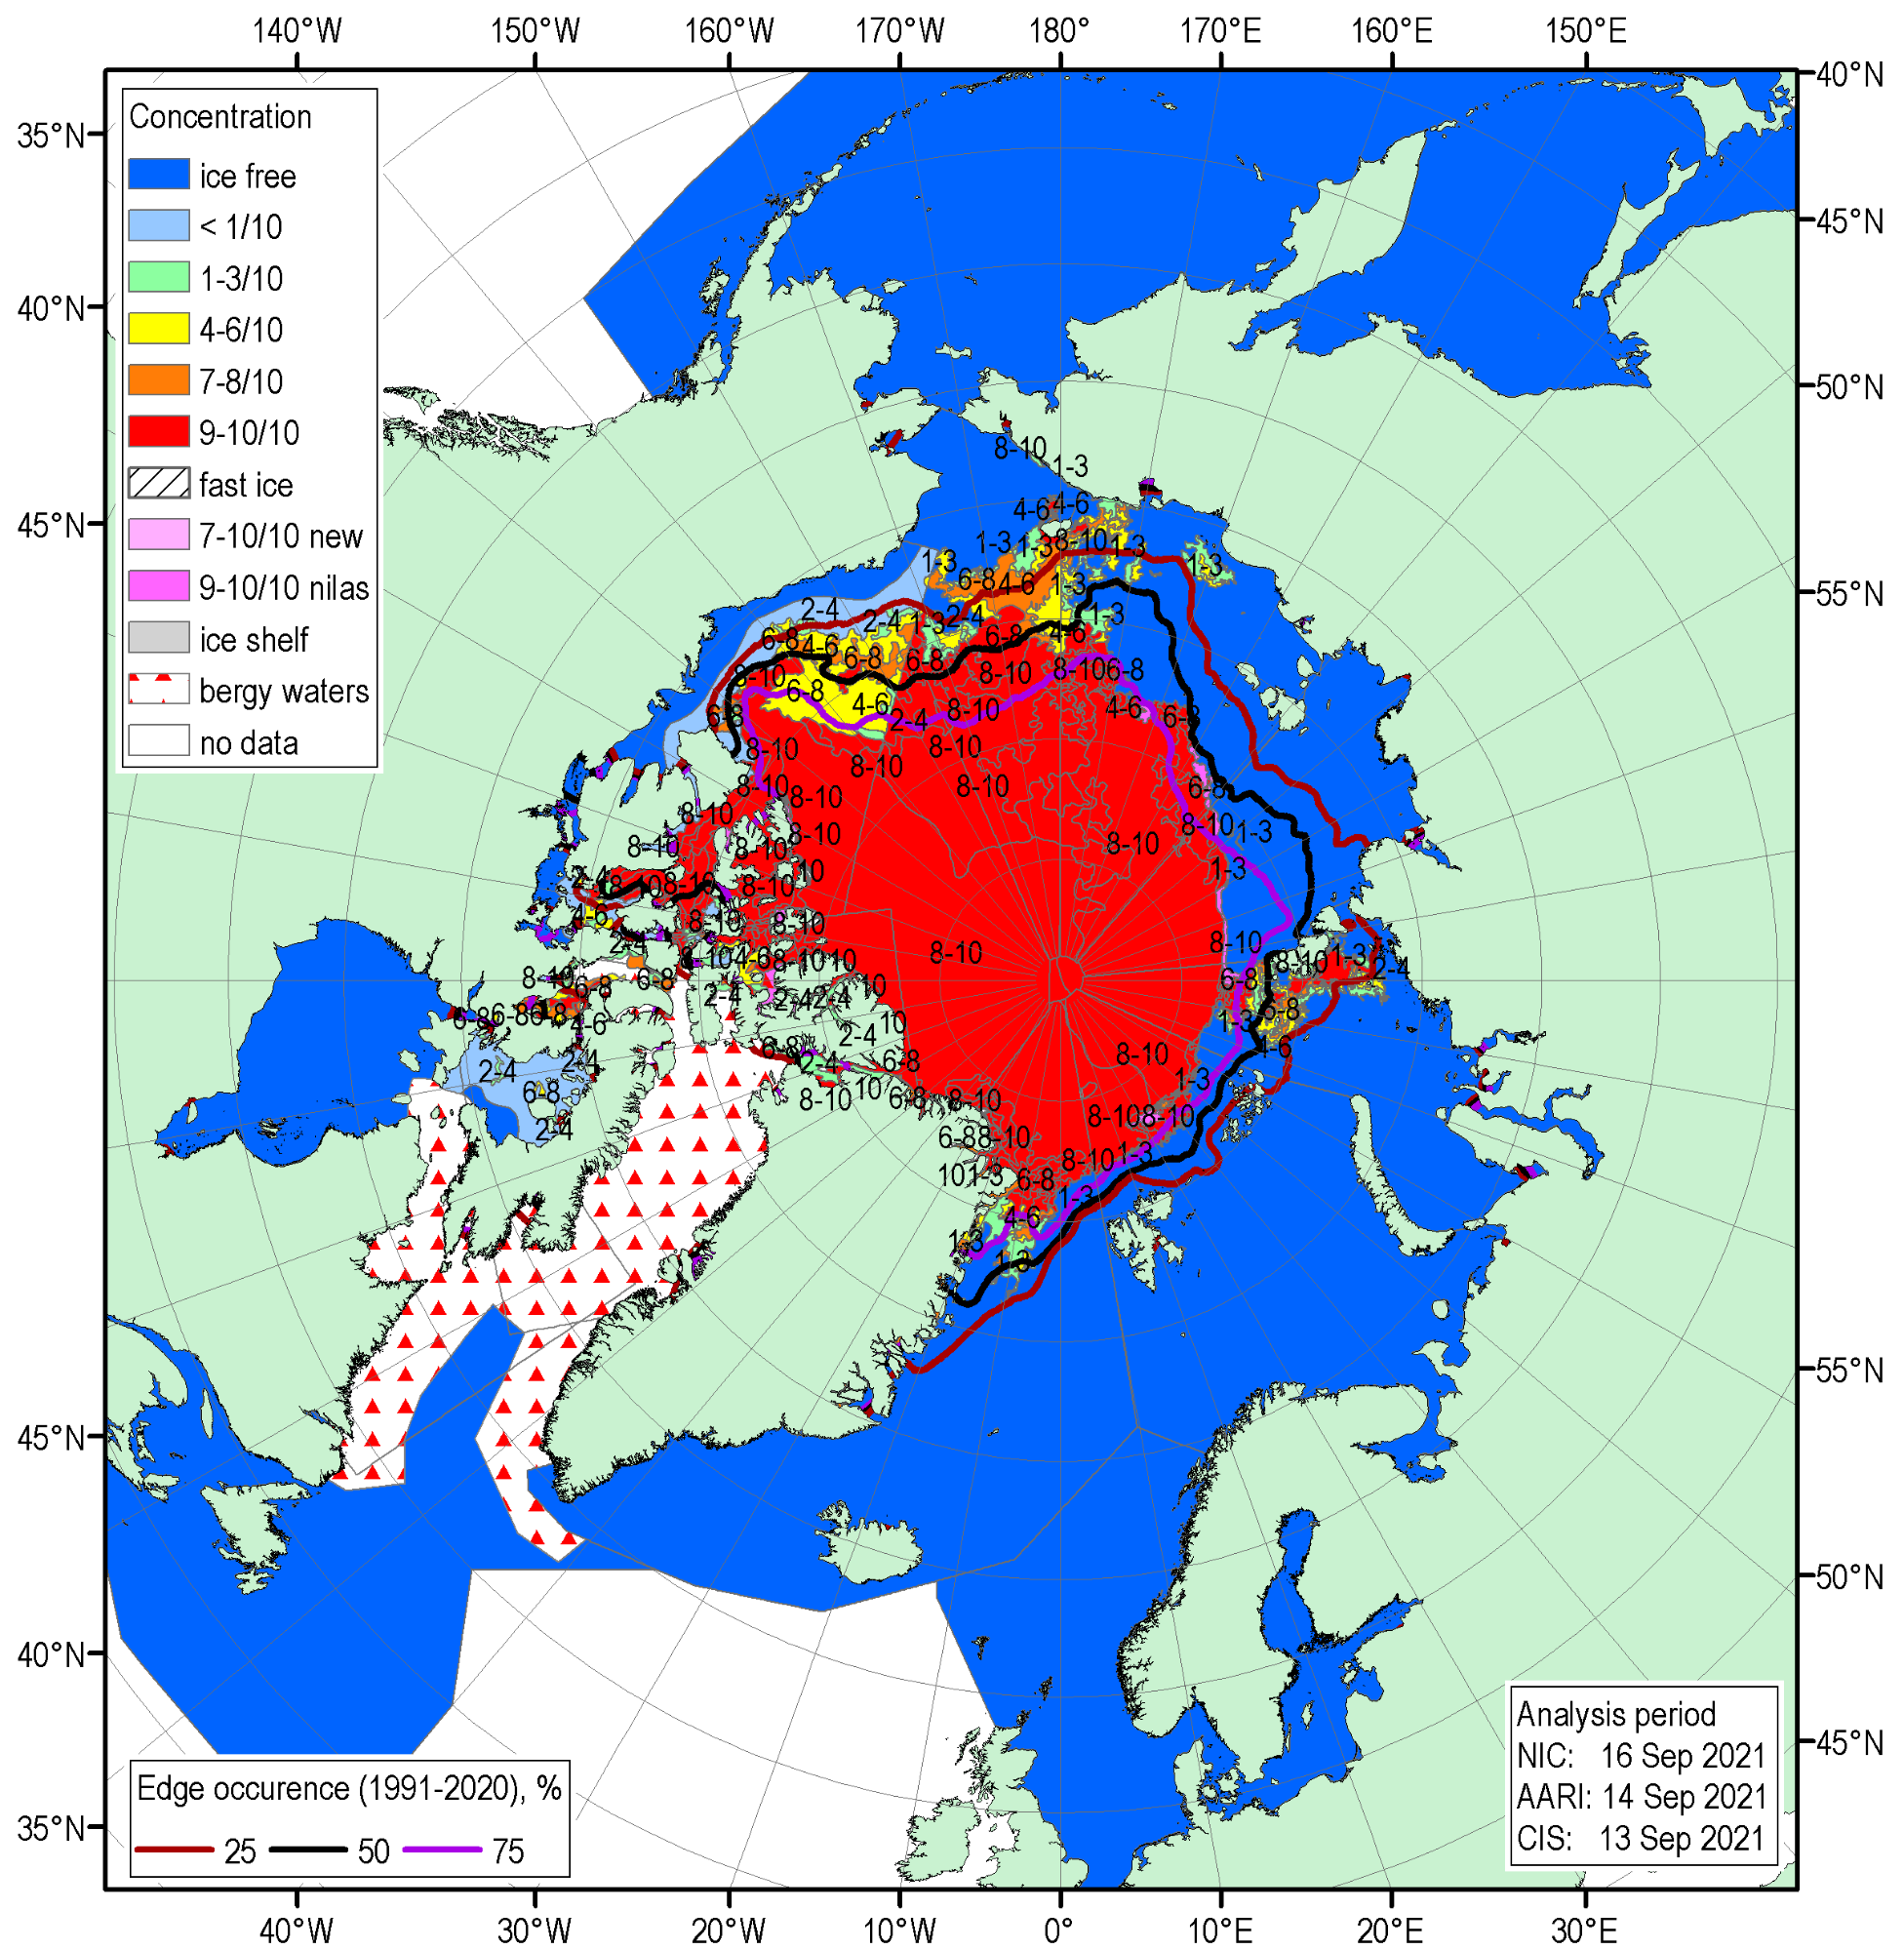
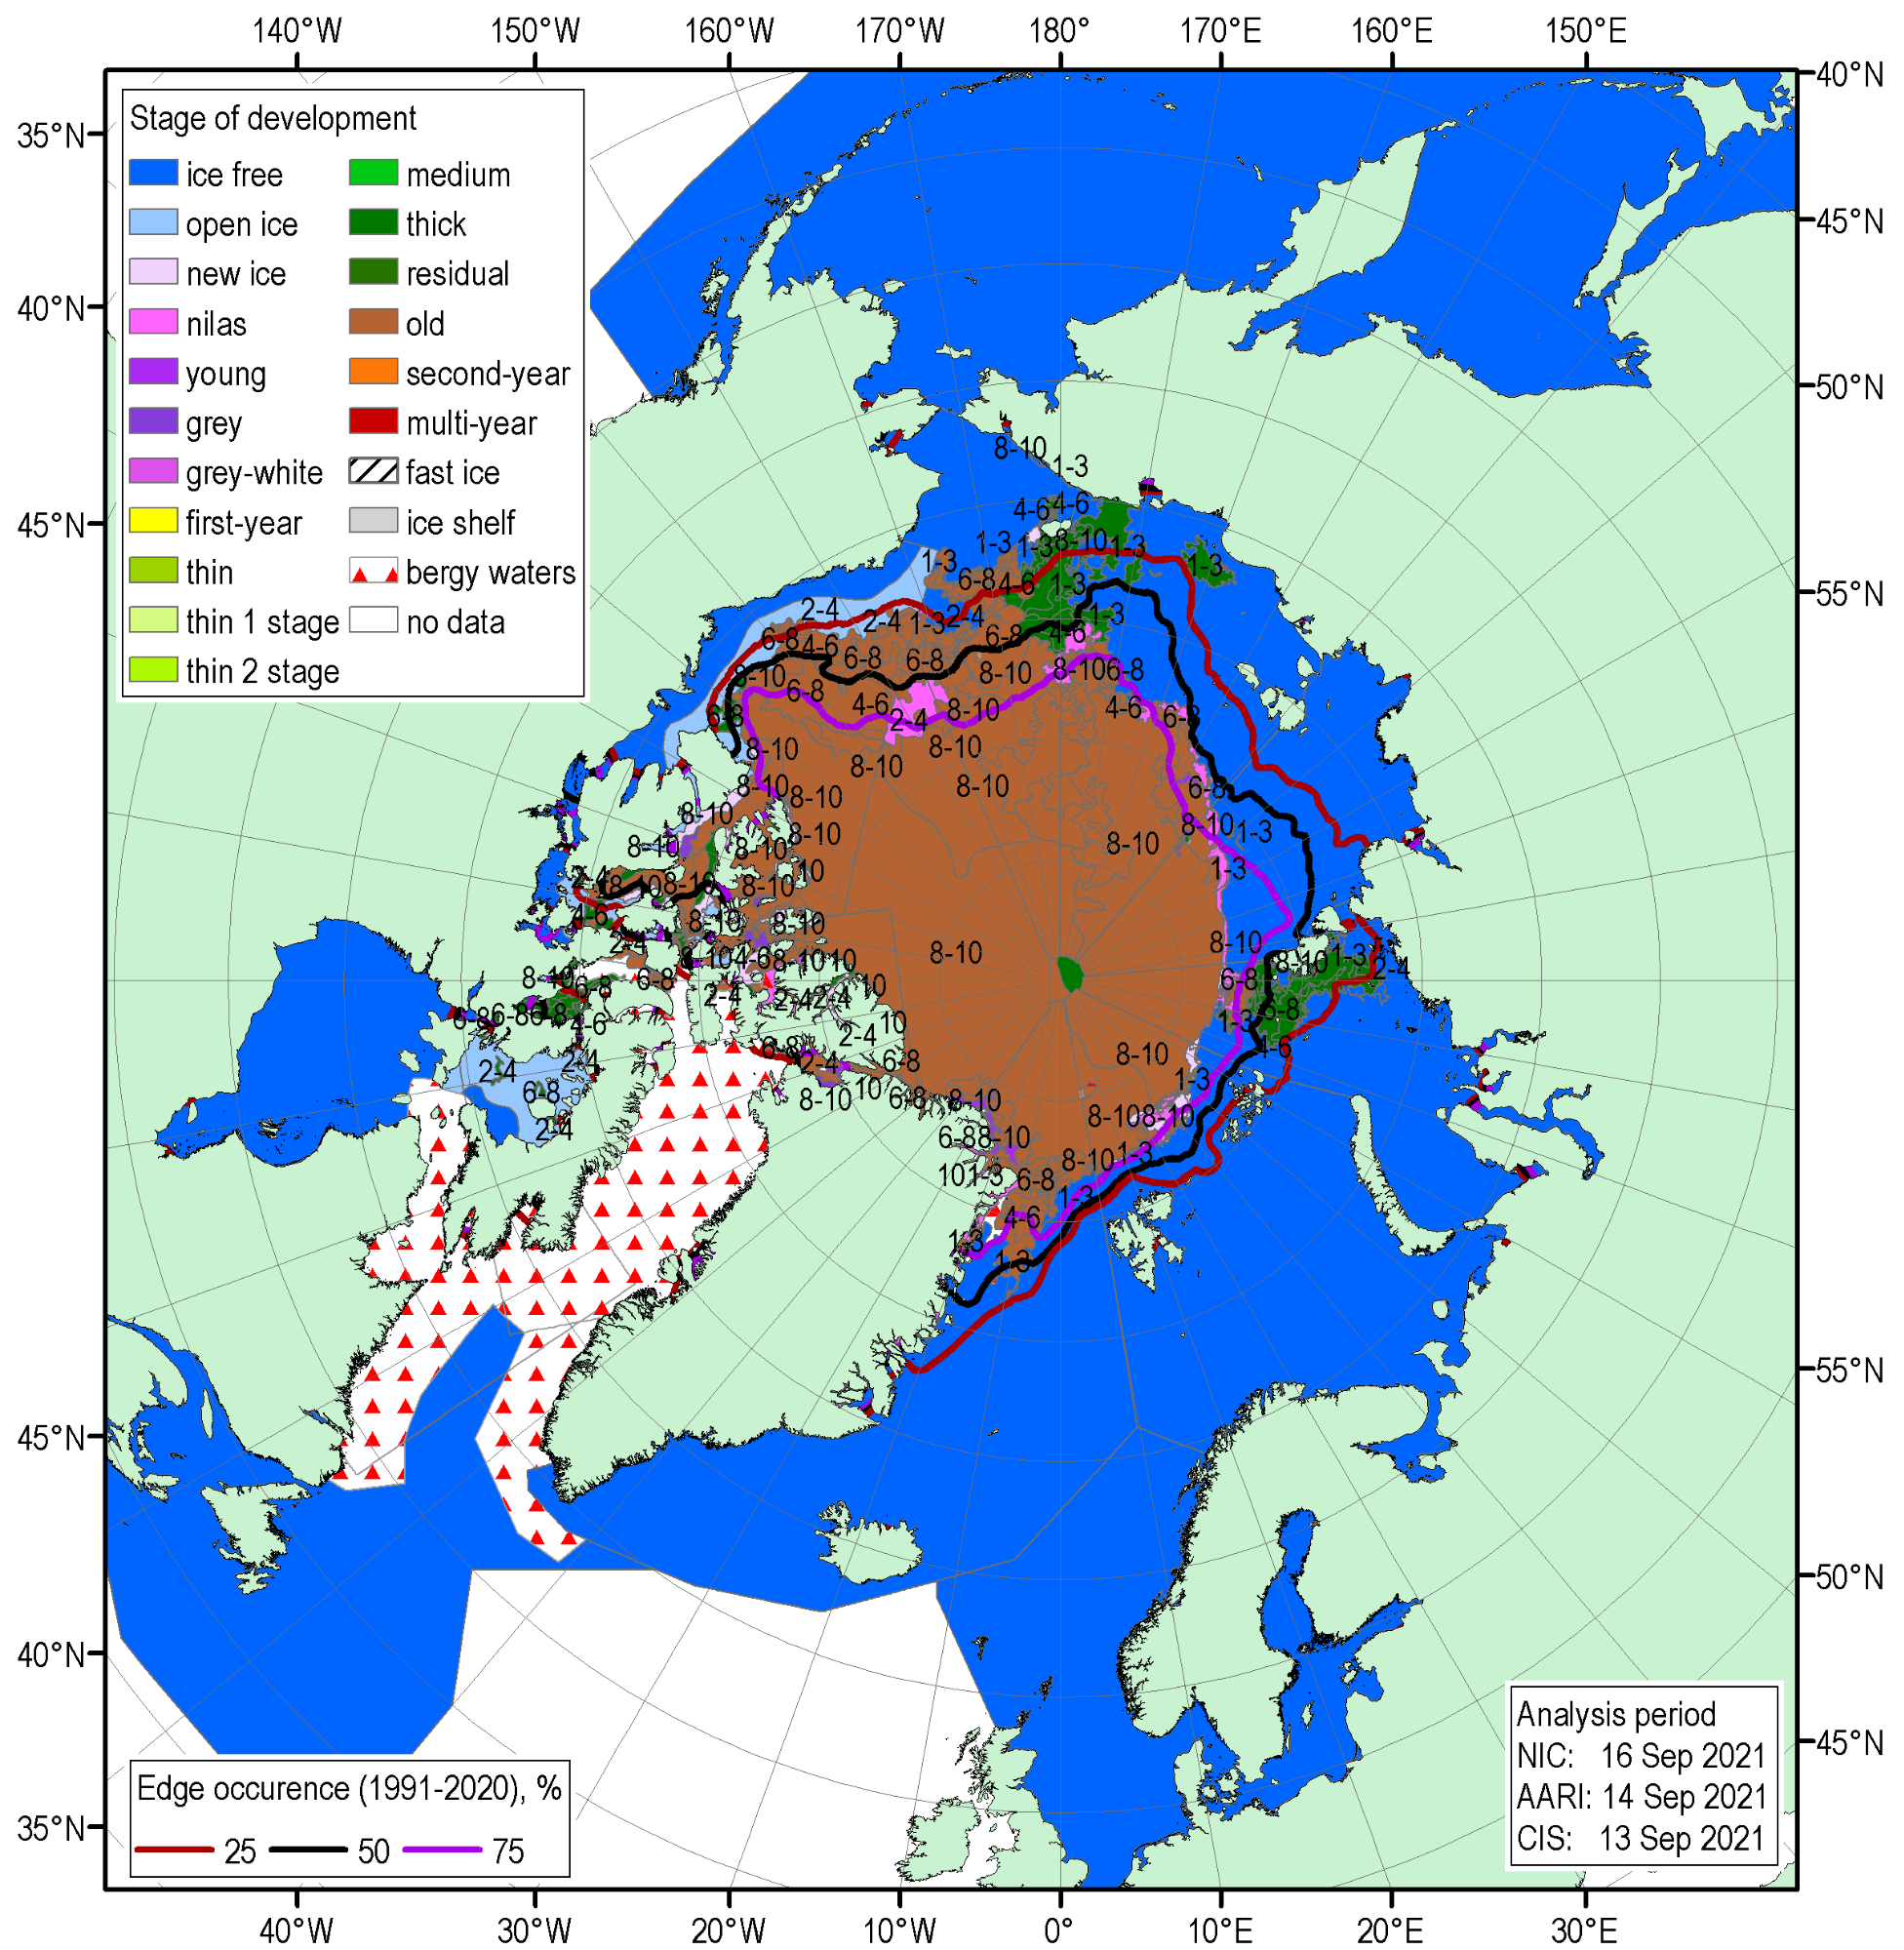
The figure below shows the blended Arctic ice chart (AARI, CIS, NIC) for 13-16 September 2021 and sea-ice edge occurrences for 11-15 September for 2000-2019, with total concentration (top), and predominant stage of development (bottom).
Surface air temperature anomalies and the heat content (HC) of the upper layer of the polar oceans influenced the rate of melt this summer. Negative anomalies of ocean heat content in the upper 15 meters of the ocean in July 2021 (MERCATOR Ocean reanalysis, not shown here) slowed ice melt in the Kara, East Siberian and Chukchi Seas. A slow melt was reinforced by negative or neutral surface air temperature anomalies in June, July and August 2021 over parts of the Canadian Arctic, Chukchi Sea, Arctic Basin and eastern parts of the Kara and East Siberian Seas.
The 4.8 mln km2 minimum sea-ice extent reached on September 12, 2021 is a 0.9 mln km2 increase compared to last year’s minimum and is the 12th lowest minimum sea-ice extent since 1979, with the minimum summer sea-ice extent observed in 2012 (3.35 mln km2). Estimates of the sea-ice volume based on numerical reanalysis (HYCOM-CICE, PIOMAS, not shown here) also show a slight recovery with a sea-ice volume higher than last year and comparable to September 2017. Ice masses of thick first year ice were present in the Eurasian Arctic throughout the summer and were still present in mid-September as a result, the northern sea route was not consistently ice free this summer. Sea ice conditions in the Beaufort Sea and the Canadian Arctic Archipelago were close to normal with the Northwest Passage closed.
No long-range forecast for these sea ice charts for this period.