This is the main result from the climate summary stated in the ACF-9 Consensus statement, for temperature, precipitation and sea ice for the period November 2021 to April 2022. View the full climate summary presentation for more details.
Temperature November 2021 to April 2022 Summary
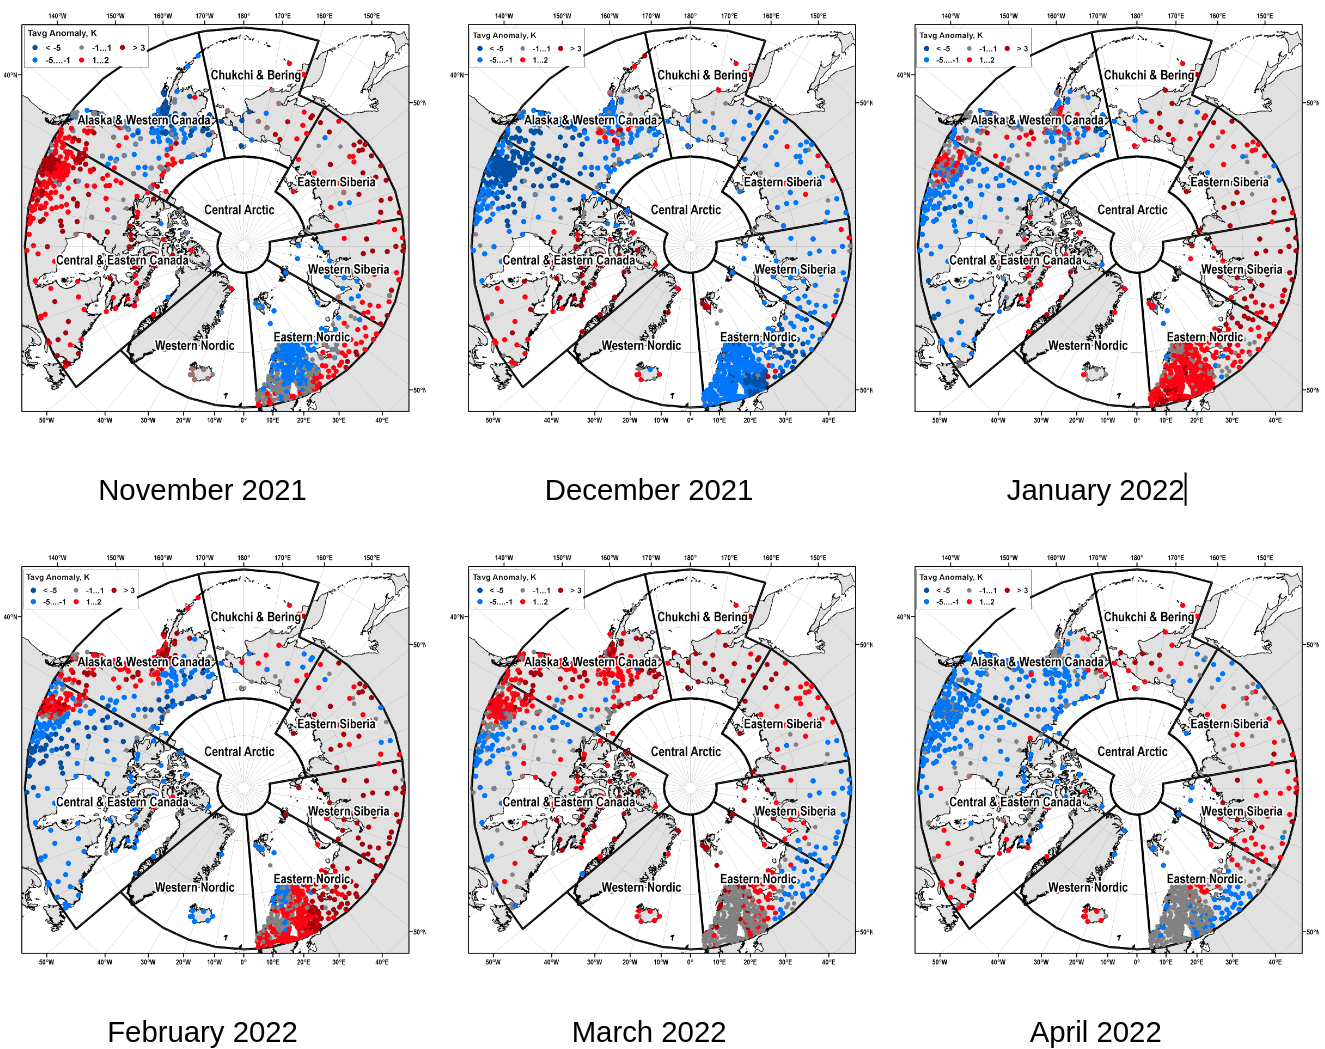
The figure below shows November 2021 – April 2022 monthly averaged SAT anomalies from the referece period 1991-2020 based on observations at polar stations. The maps are produced by the Arctic and Antarctic Research Institute Note: information for the stations outside of the ArcRCC-N domain is not shown.
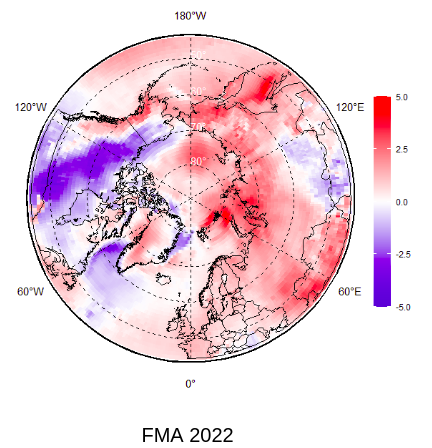
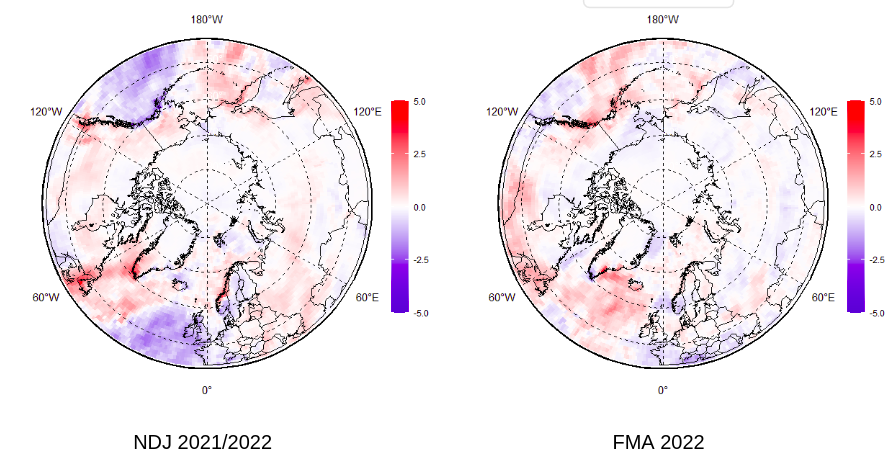
The figure below shows November, December and January 2021/2022 (to the left) and February, March, and April 2022 (to the right) Surface Air Temperature (SAT) anomalies from the 1991-2020 reference period. The map is produced by the Arctic and Antarctic Research Institute with ERA5 as data source. The image can be clicked to show SAT for FMA 2022 together with the forecast for the same period issued in January 2022.
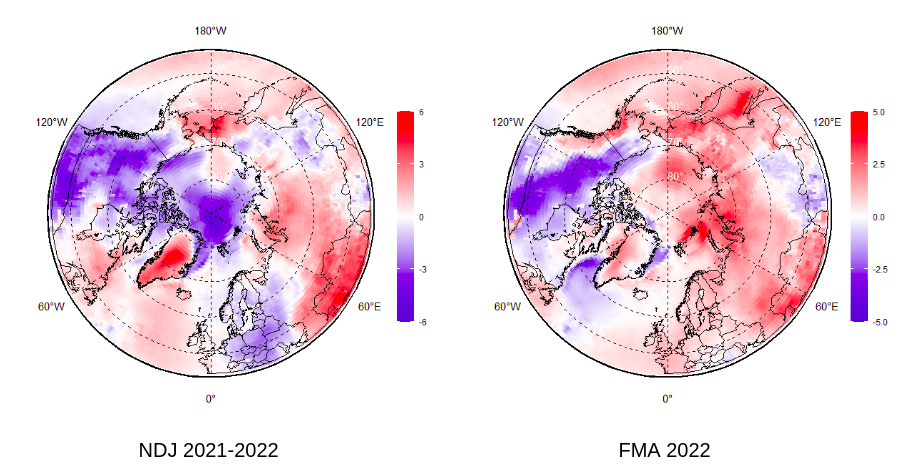
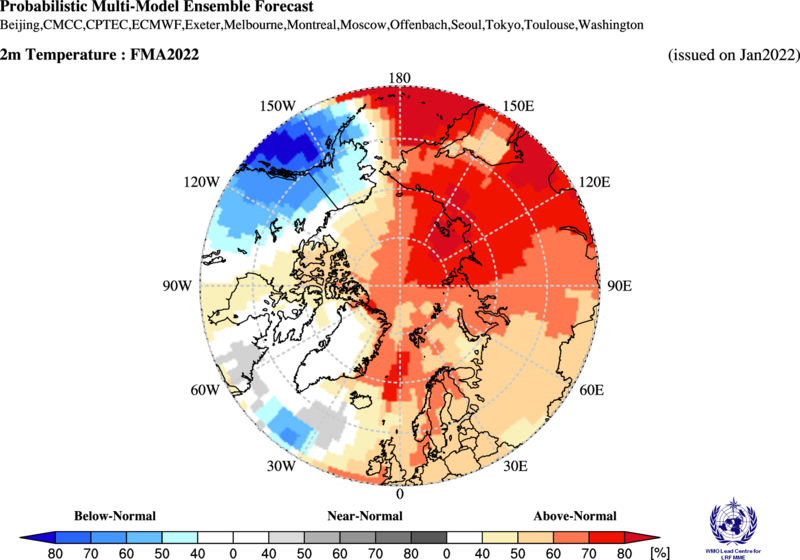
Click image to see forecast and climate summary for FMA 2022 side by side.
The start of winter 2021/2022 (November-December) surface air temperature (SAT) experienced prominent positive – in Central and Eastern Canada (3rd in row), Eastern Siberia (7th in row) and negative – Alaska (62nd in row), Eastern Nordic (51st in row) anomalies (to 3rd WMO reference period 1991-2020 and 1950-2021/2022 observation period for ranks). During mid-winter (January-February) strong positive anomalies were observed over the Eastern Nordic (15th in row), Western and Eastern Siberia (4th – 12th in row) with negative anomalies observed over Western Nordic region (56th in row). Further by the end of winter and early spring in March – April 2022 both positive and negative anomalies were observed over Alaska (29th and 55th in row), Canada (11th and 29th) and Nordic regions and mostly positive over Siberia (16th – 30th in row) and Chukchi (6th – 10th in row) regions. Due to lack of surface marine observations conclusions for the Central Arctic done on the basis of reanalysis, include partly colder conditions in November 2021, predominantly warmer in February – March 2021, and colder in December 2021 and April 2022. For the whole land Arctic, the prominent warmer conditions were observed in November 2021 (12th in row) with prominent colder in December 2021 (47th in row) and April 2022 (38th in row).
×
Forecasted temperature for February, March and April 2022.
Temperature summary for the same period.
Precipitation November 2021 to April 2022 Summary
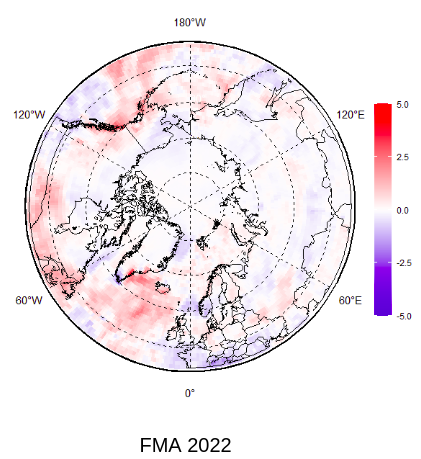
The figure below shows November, December and January 2021/2022 (to the left) and February, March, and April 2022 (to the right) precipitation anomalies from the 1991-2020 reference period. The map is produced by the Arctic and Antarctic Research Institute with ERA5 as data source. The image can be clicked to show precipitation for FMA 2022 together with the forecast for the same period issued in January 2022.
In general, during the whole season, wetter (snowy) conditions occurred in most parts of Canada, Alaska, Bering & Chukchi and Western Nordic regions. Drier conditions occurred in parts of Eastern Nordic, Siberia and Central Arctic regions. The least amount of precipitation was for the Eastern Nordic and Siberia regions. More abundant precipitation was observed in the Western Nordic, Bering and Chukchi, Canada and Alaska regions. Somewhat drier or close to normal conditions were estimated for the Central Arctic.
Click image to see forecast and climate summary for FMA 2022 side by side.
×
Forecasted precipitation for February, March and April 2022.
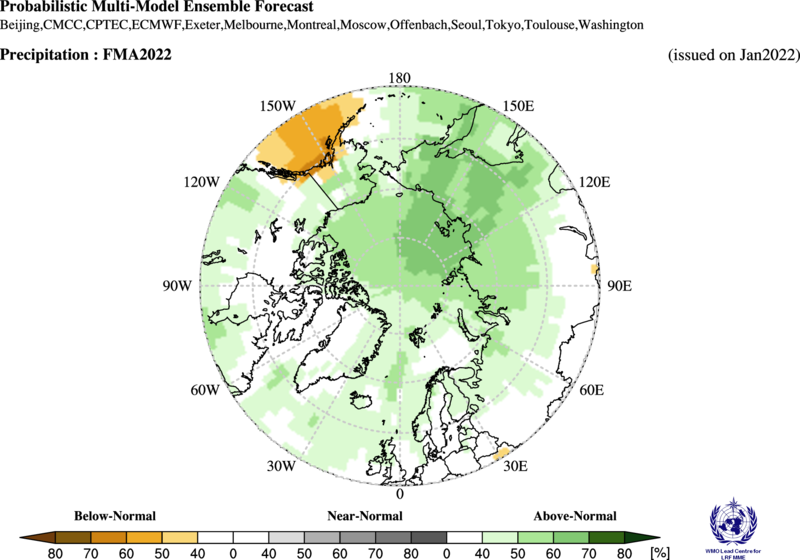
Precipitation summary for the same period.
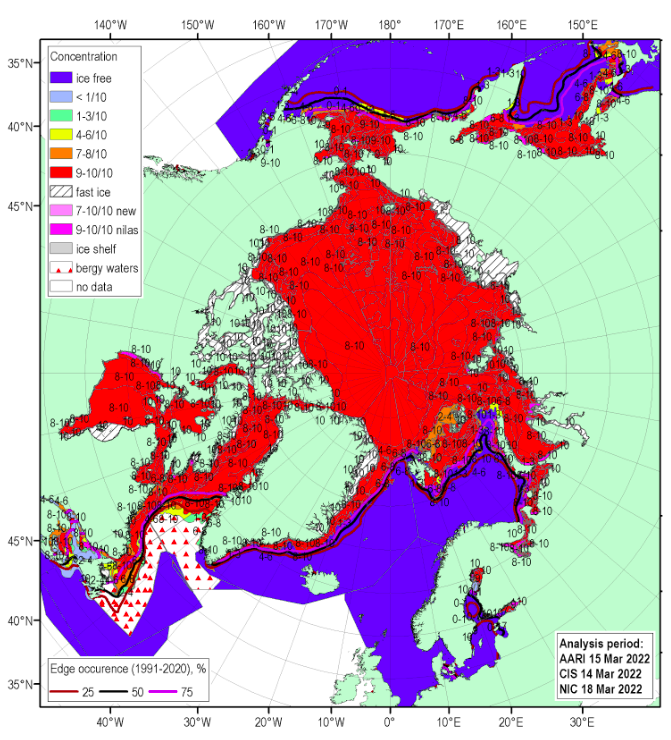
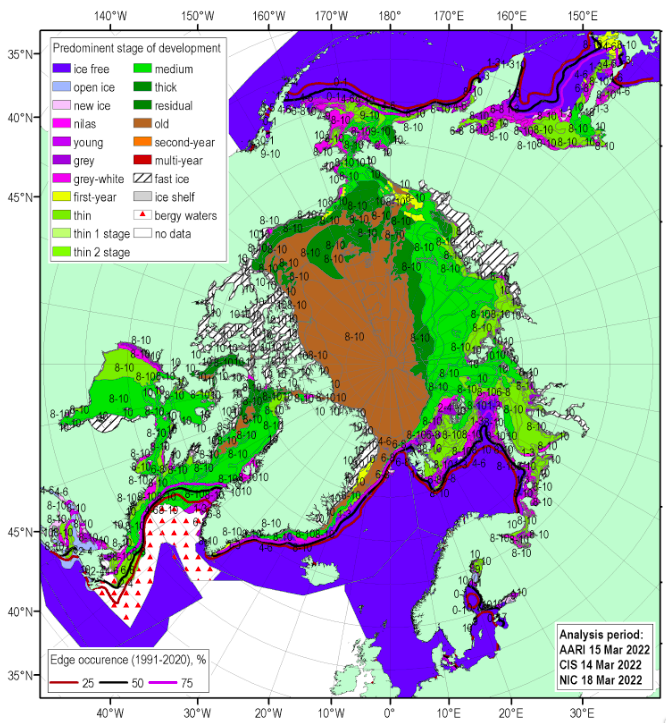
Sea Ice Summary for March 2022
The figures below shows the blended Arctic ice chart (AARI, CIS, NIC) for 14-18 March and ice edge occurences for 11-15 March with reference period 1991-2020, with total concentration at the top, and predominant stage of development at the bottom. The ~15.2 million km2 maximum winter ice extent was reached on 21-22 of February 2022, being 13th in row since 1979. This was close to the sea ice extent in 2021 (~15,1 million km2, 10th in row, reached on 4 March in 2021). The 2022 maximum correlates somewhat with previous summer 2021 minimum, which was ranked as the 12th lowest sea ice extent. The 1-2 weeks earlier date of maximum ice extent than the 1979-2022 average, was mostly due to degraded state of the Sea of Okhotsk ice cover though prevalence of negative surface air temperature anomalies over the Arctic Ocean by the end of winter 2022 stimulated general ice growth till the end of April 2022 as well as led to greater than 45years median ice extent in Canadian Arctic. Seasonal patterns of daily ice extent (figure 17 right) allow to retrieve additional information on interseasonal variability of ice extent. Though both winter maximums and summer minimums continue to diminish there is a certain hint to possibility for summer ice cover in 2022 to be greater than in 2019-2021.
No long-range forecast for these sea ice charts for this period.